When you've been showing for years it often becomes hard to identify which are your best and worst models. Sometimes you probably feel like you take the same models to every show and although you feel like they are your best they aren't actually doing as well as you would like.
So today I'm going to share with you a quick and easy way to rank your horses and get a good picture of who is still succeeding and who is falling short. All you will need is MS Excel (or similar) and a bit of time and patience.
Scoring System
The first step is to create your own scoring system. You will need to allocate a number of points to each of the different awards your models can win. How many points you award is up to you but it needs to be consistent.
My points system is below:
Overall Champion = 100
Overall Reserve Champion = 85
Overall Reserve To Reserve Champion = 70
Section Champion = 50
Section Reserve Champion = 40
Section Reserve to Reserve Champion = 30
Top 10 = 25
Champion = 20
Reserve Champion = 15
Reserve To Reserve Champion = 10
Best of Breed/Group Winner = 8
1st Place = 6
2nd Place = 5
3rd Place = 4
4th Place = 3
5th Place = 2
6th Place = 1

To work out the average points you will need to enter the following formula into D2

Now you can go about populating your spreadsheet. This is going to be extremely time consuming if you have been showing for years and just starting out so maybe try to aim for a year a week or something similar!

Sorting Your Horses
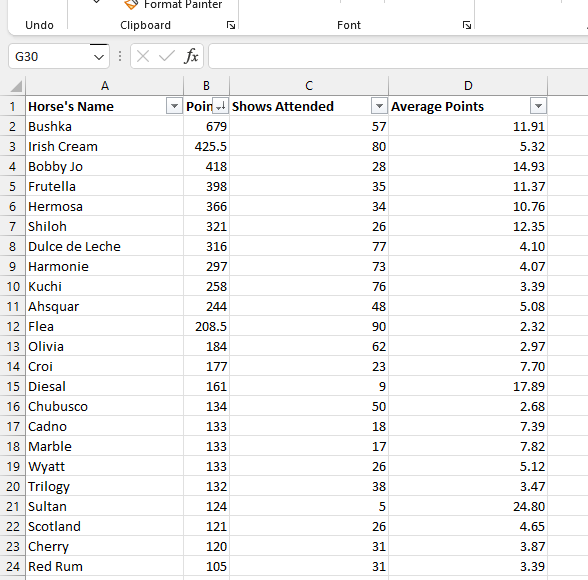
And the second is sorted by average points:

You will see the two lists are very different. One of the reasons you want to use average points over total points to see your top horses is that if you have a model that you have been showing for years (like Bushka for example) they will have a LOT of points and it will be hard for newer models (like Sultan for example) to make their way onto the list. Look at how many shows Bushka has attended compared to Sultan! Using average points therefore allows you to ensure that new horses that are doing well fit into your show string and old horses that maybe did well in the past but haven't placed in years drop out.
I have also started linking these into my Massive Horse Spreadsheet. This means that I can sort by things such as make, scale and breed to tell you who my best OF Arabian or best CM Thoroughbred is. This is really helpful when it comes to specialist shows.